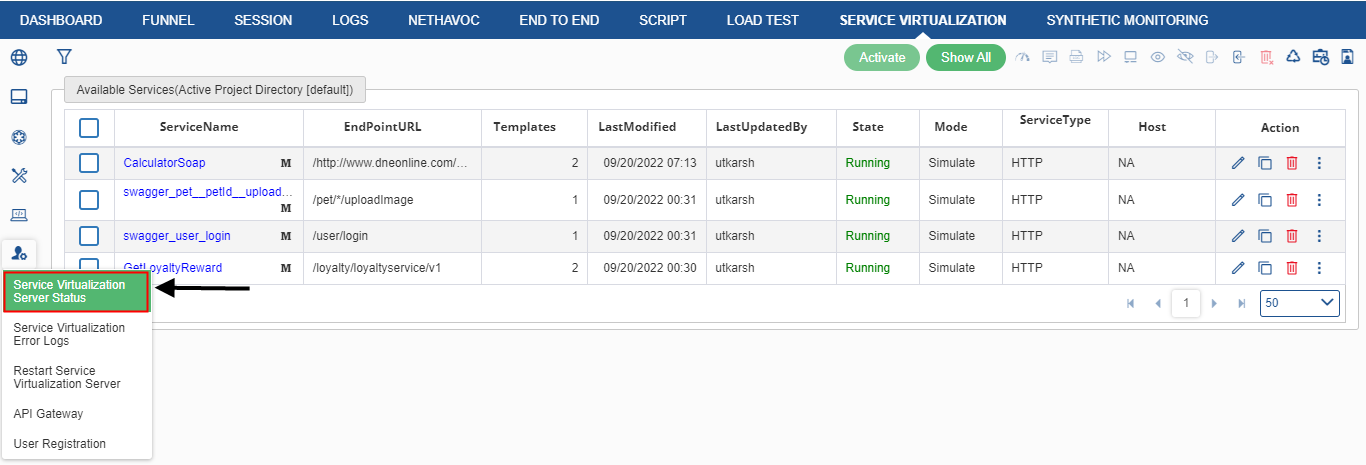
In Service Virtualization, go to Admin → Service Virtualization Server Status.
Figure 213: Service Virtualization Server Status Selection
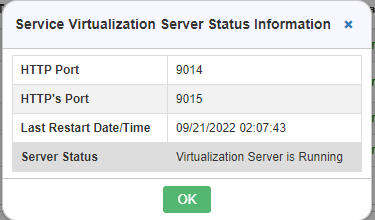
On clicking the Service Virtualization Server Status window is displayed.
Figure 214: Service Virtualization Server Status Information
In the Service Virtualization Server Status window, user can see the following information:
A. HTTP Port B. HTTP’s Port C. Last Restart Date/Time D. Server Status
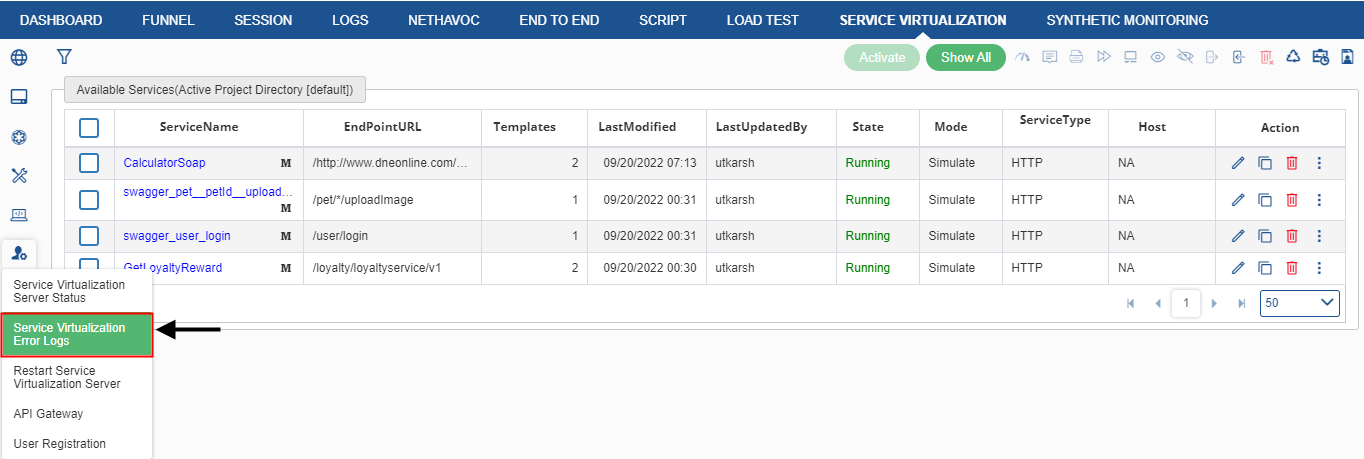
Service Virtualization Error Logs
In Service Virtualization, go to Admin → Service Virtualization Error Logs.
Figure 215: Service Virtualization Error Logs Selection
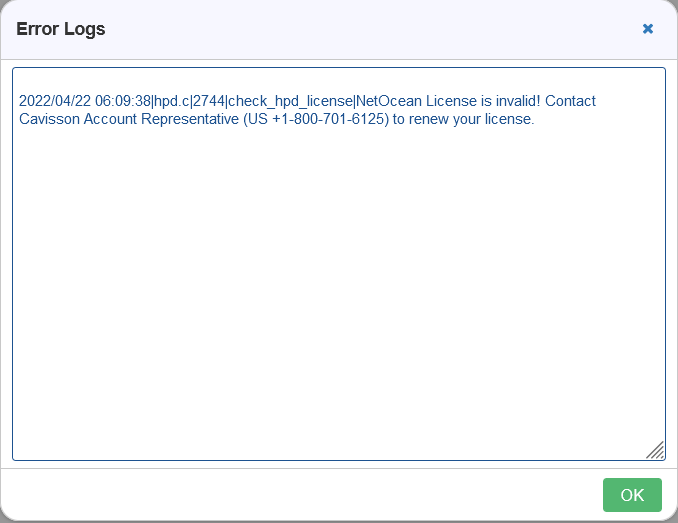
On clicking Service Virtualization Error Logs window is displayed.
Figure 216: Service Virtualization Error Logs window
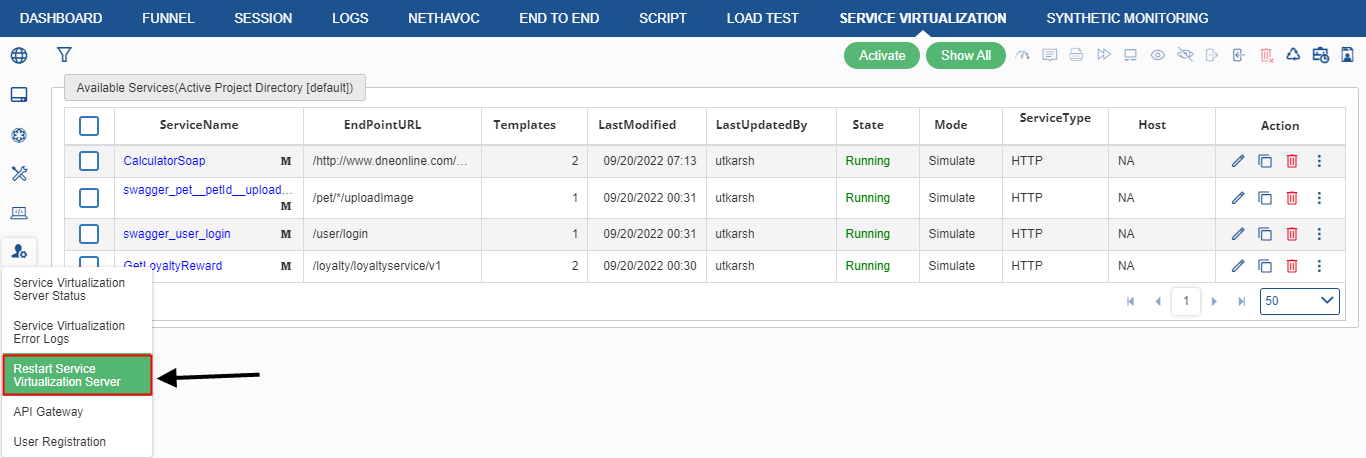
Service Virtualization Restart
In Service Virtualization, go to Admin → Restart Service Virtualization Server.
Figure 217: Restart Service Virtualization Server
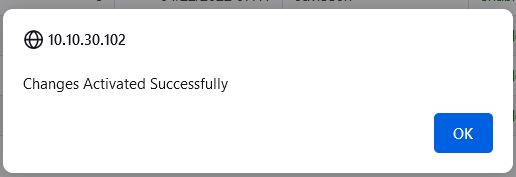
On clicking RestartService Virtualization server, it will show the “Changes Activated Successfully” window.
Figure 218: Restart Service Virtualization Window
This shows that the Service Virtualization has successfully restarted.
API Gateway
Cavisson API provides a high availability load balancer and proxy server for TCP and HTTP-based applications that spreads requests across multiple servers. Cavisson API products and services deliver websites and applications with the utmost performance, observability, and security at any scale and in any environment.
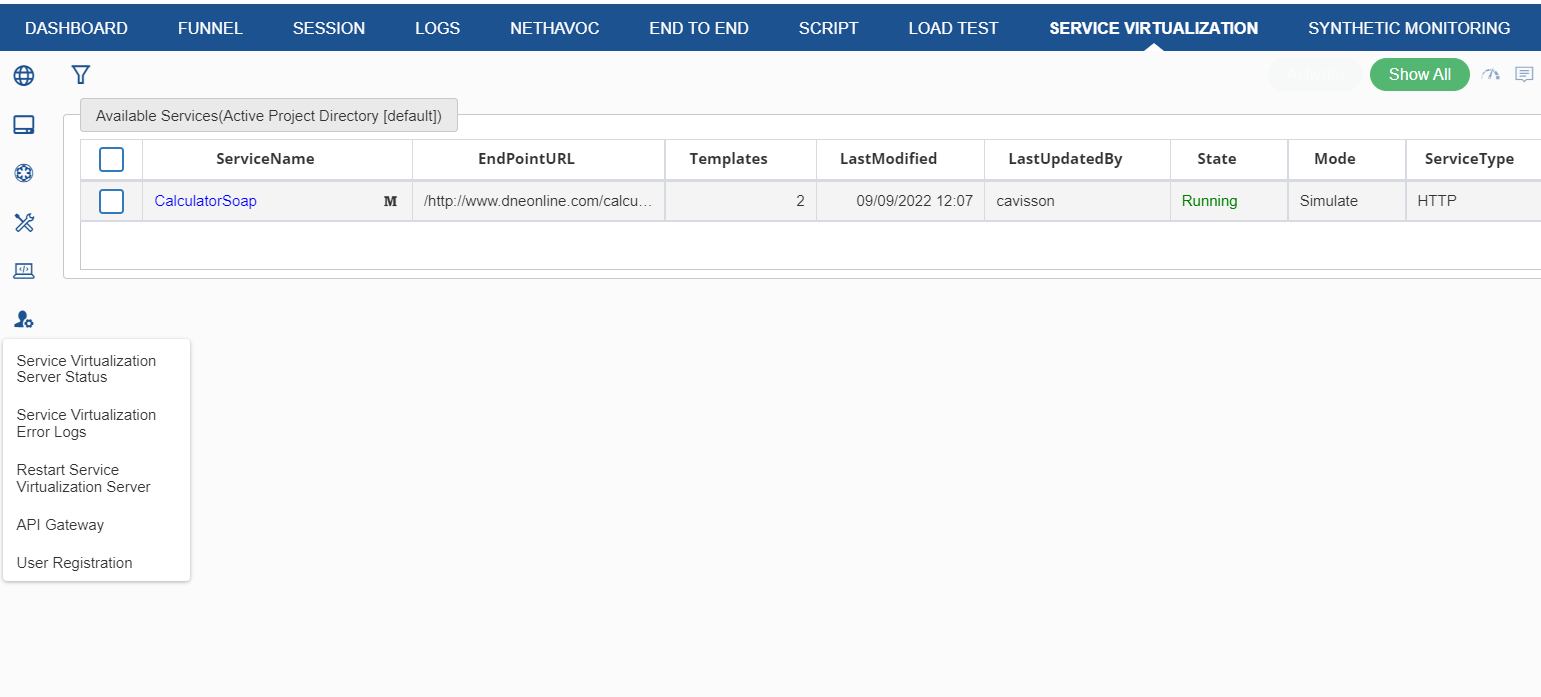
Accessing API Gateway UI
User can add the headers and run the API gateway from the UI.
To access the API Gateway UI, go to Admin > API Gateway.
Figure 219: API Gateway
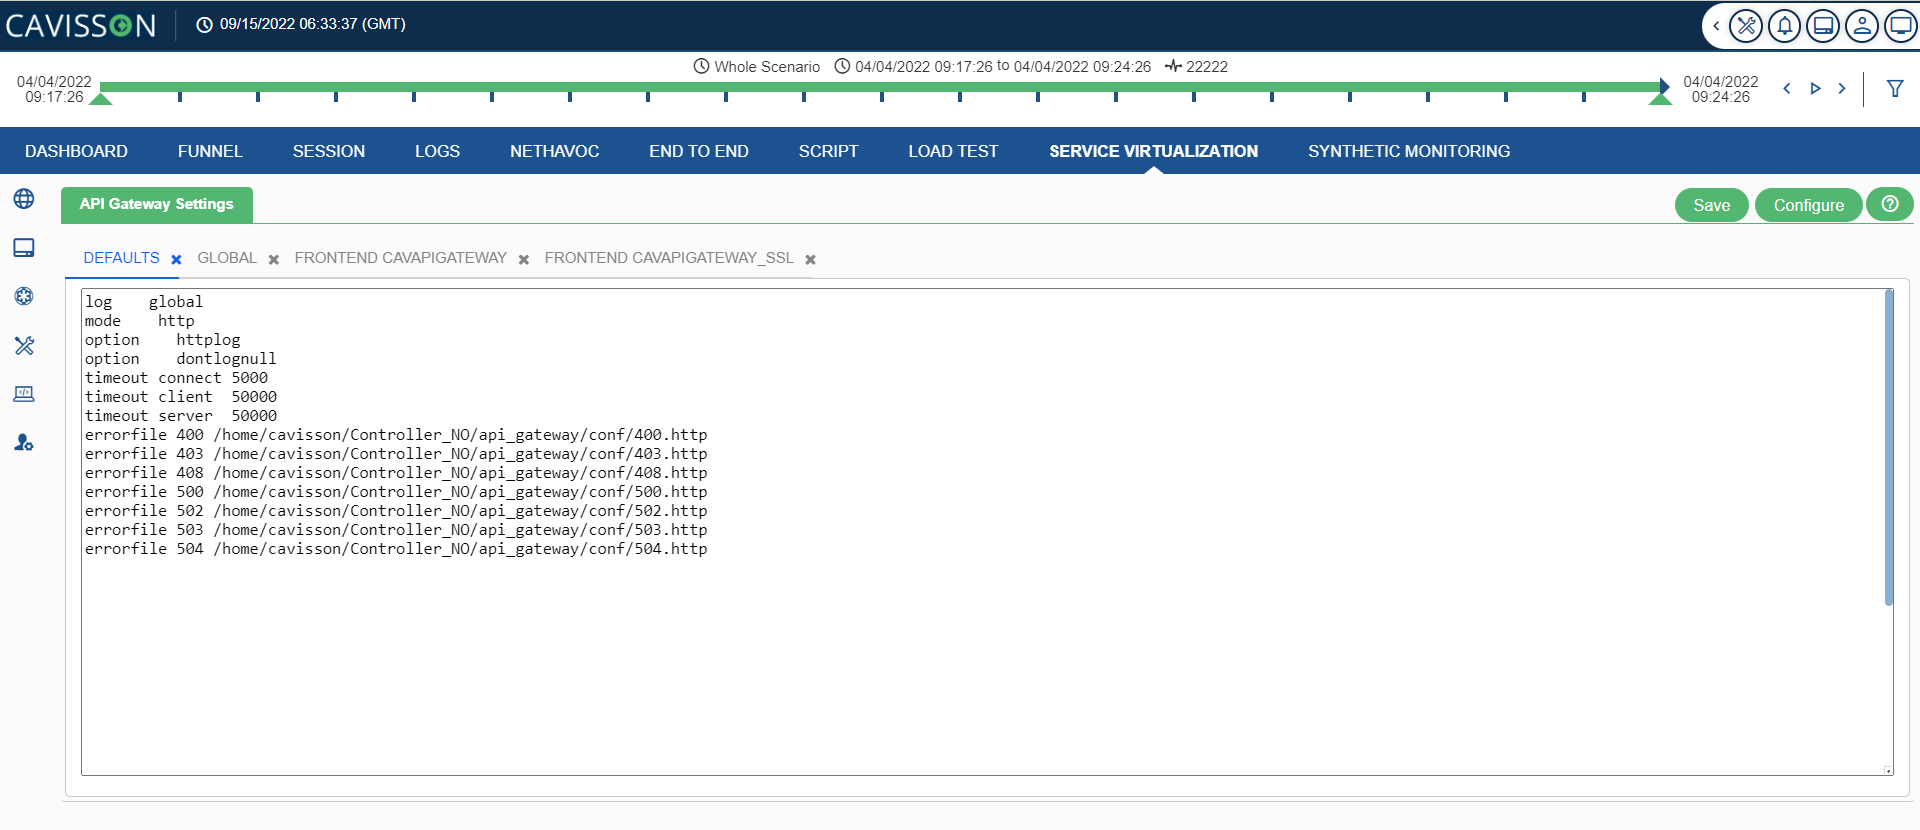
2. This displays the following window with some default tabs, such as – DEFAULTS, GLOBAL, FRONTEND CAVAPIGATEWAY, FRONTEND CAVAPIGATEWAY_SSL.
Figure 220: API Gateway Settings
Adding a Configuration
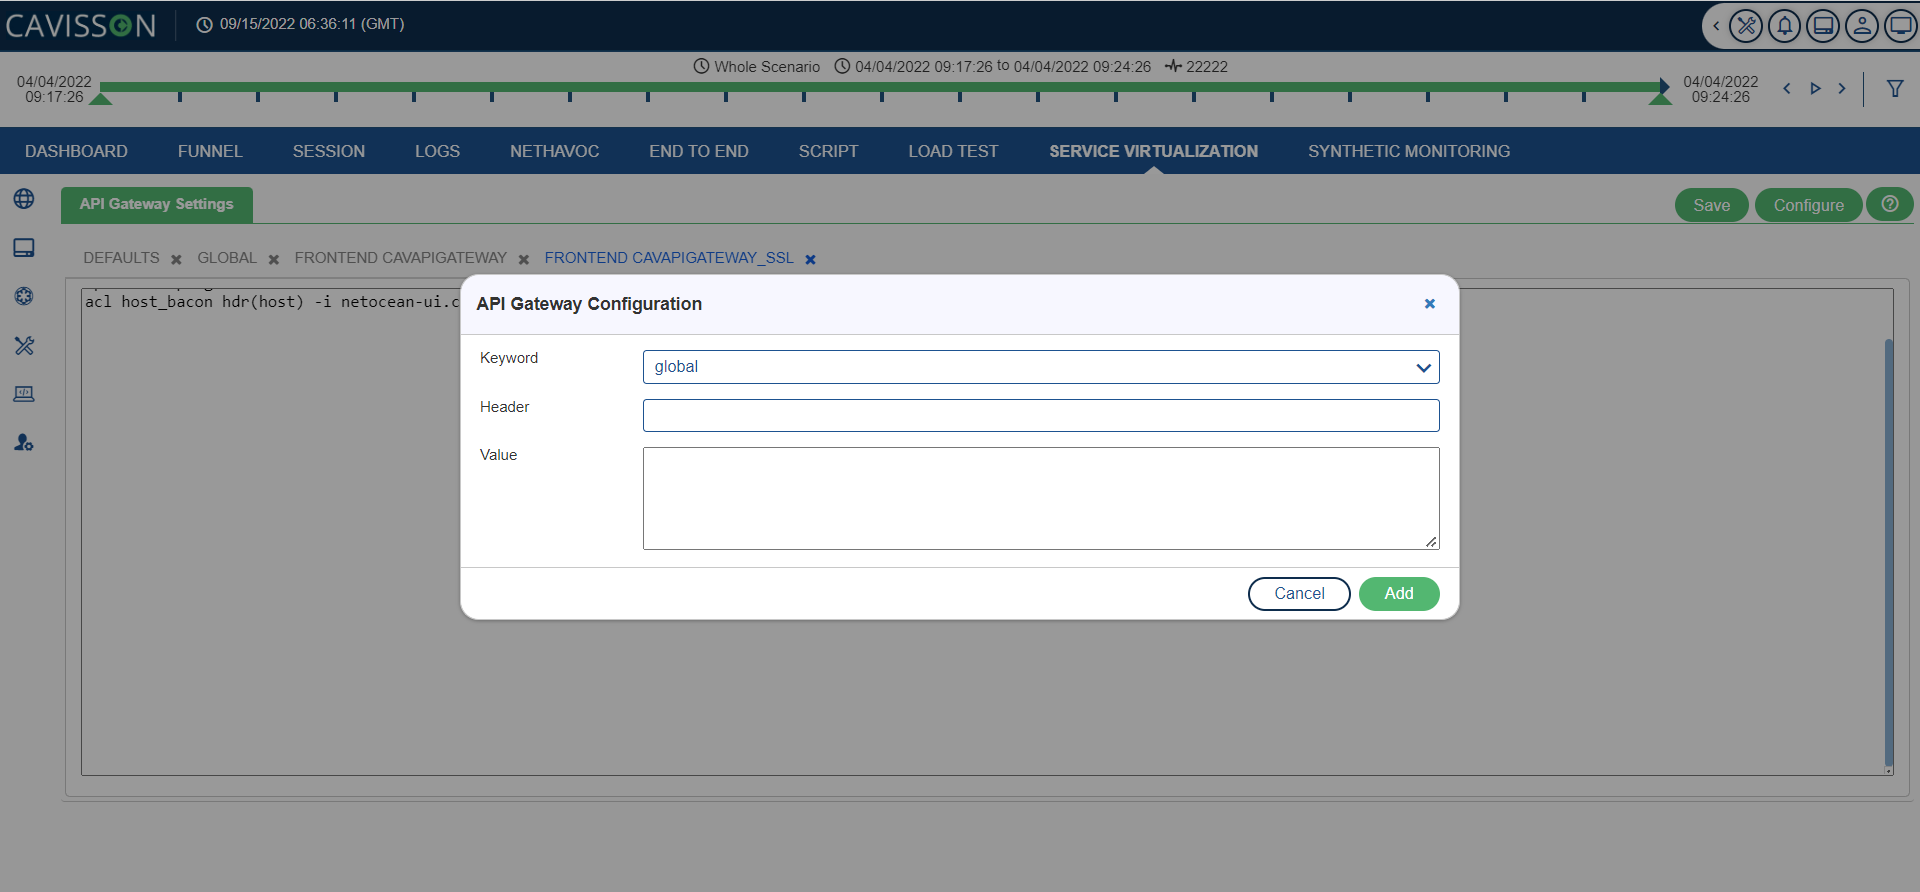
Click the Configure This displays the API Gateway configuration Configure window.
Figure 221: API Gateway Configuration
2. Enter the following details:
Keyword: This field is predefined and custom also. Select the appropriate option from the drop-down and give it manually as per the requirement.
Header: Name of the header. It must start with an alphabet and should be in a proper format.
Value: Value of the header.
3. Click Add and then Save. A confirmation message is displayed for successful configuration.
User Registration
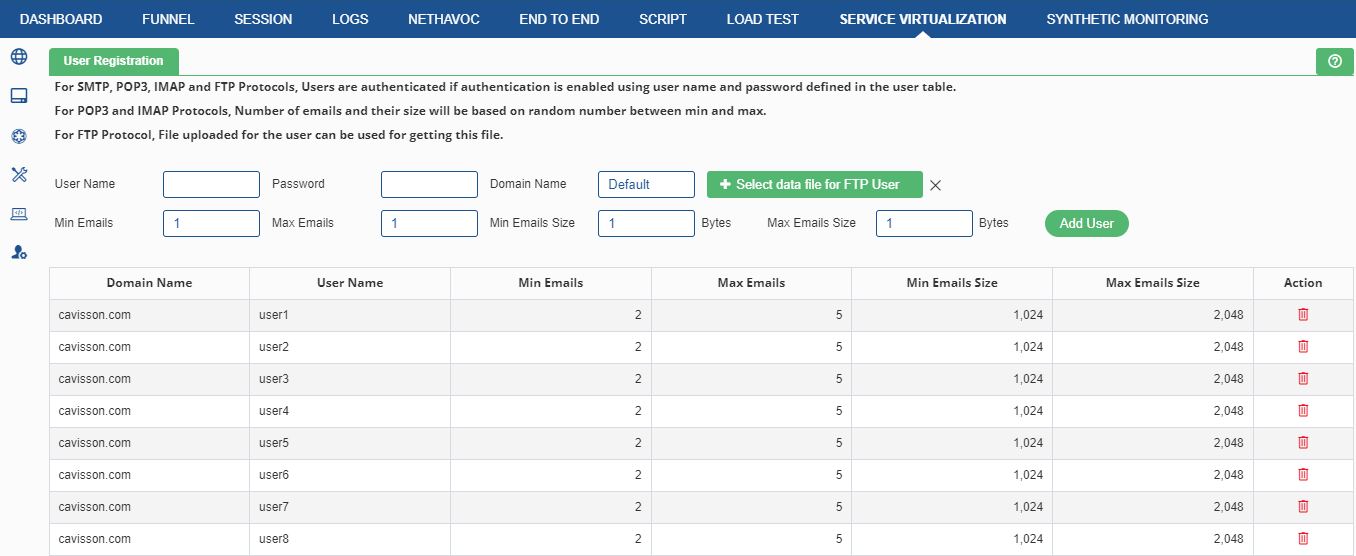
To register a new user and configure the information related to it.
Figure 222: User registration
Protocol
SMTP: A communication protocol for electronic mail transmission.
IMAP: An Internet standard protocol used by email clients to retrieve email messages from a mail server over a TCP/IP connection.
POP3: An Application-layer Internet standard protocol used by email clients to retrieve email from a mail server.
FTP:A standard network protocol used for the transfer of computer files between a client and server on a computer network.
Domain Name: Domain name of the server for transferring files.
Username: Authentication Username. The maximum length of username is 65.
Password: Authentication Password. The maximum length of password is 65.
Number of Emails: Random number is chosen between minimum emails and maximum emails. And that will be considered as the actual number of emails.
Minimum: Number of minimum emails. The number of minimum emails is 1.
Maximum: Number of maximum emails. The number of maximum emails is 1024.
Number of Bytes for an Email:A random number of bytes is chosen between minimum bytes and maximum bytes. And that will be considered as the actual number of bytes for those emails.
Minimum: Minimum number of bytes for an email. The Minimum number of bytes for an email is 1.
Maximum: Maximum number of bytes for an email. The Maximum number of bytes for an email is 32K.
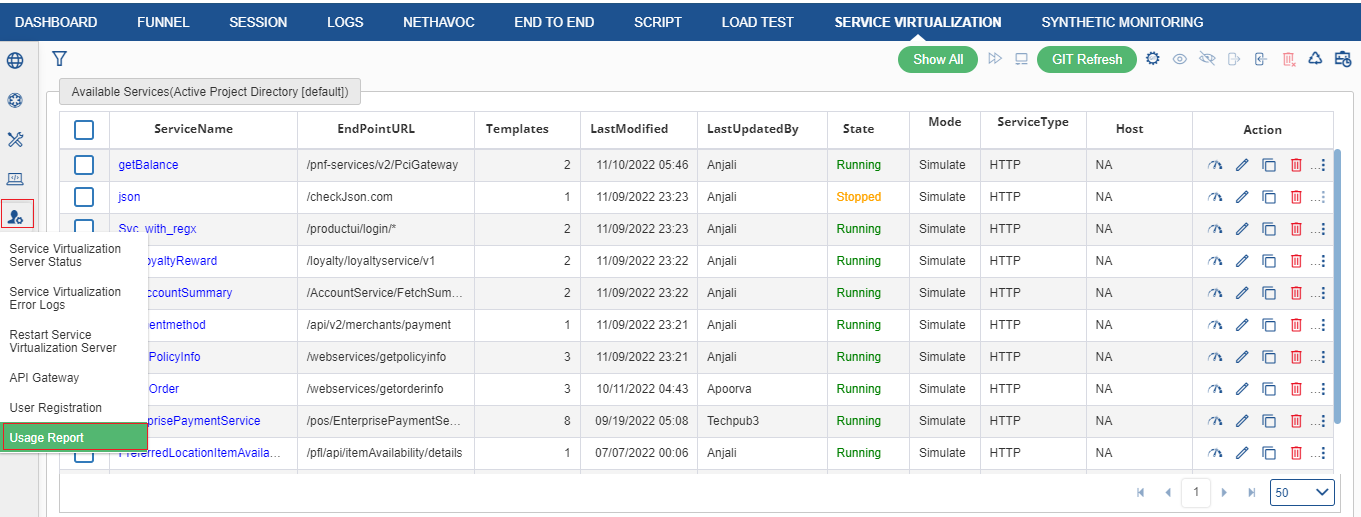
Usage Report
It is an auto-generated report which is generated for each and every TR automatically. The usage report has the summary data for the TRs. To access this, click on Admin> Usage Report as shown in figure below.
Figure 223: Usage Report Selection
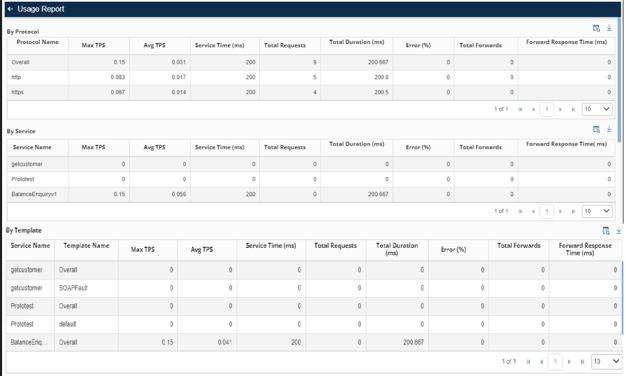
Once user click the icon, following page appears.
Figure 224: Usage Report Page
The usage report can be classified as follows:
By Protocol
By Service
By Template
Let us discuss them in detail.
By Protocol: In By Protocol, there are following fields:
Protocol Name: It contains the name of the protocol. Such as: https, dns, ftp, pop3, smtp.
Max TPS: It shows the maximum transaction per seconds done by the protocol.
Avg TPS: It shows the average transaction per seconds done by the protocol.
Service Time (ms): It shows the service time in milliseconds.
Total Requests: It shows the total number of request.
Total Duration (ms): It shows the total duration taken by the protocol.
Error%: It shows the number of error occur in percentage.
Total Forwards: It shows the total number of protocol forwarded.
Forward Response Time (ms): It shows the forwarded response time in milliseconds. By Service: In By Service, there are following fields:
Service Name: It is the name of the service.
Max TPS: The maximum transaction per seconds done by the service.
Avg TPS: The average transaction per seconds done by the service.
Service Time (ms): It shows the service time in milliseconds.
Total Requests: : It shows the total number of request.
Total Duration (ms): ): The total duration taken by the service.
Error%: The number of error occur in percentage.
Total Forwards: It shows the total number of service forwarded.
Forward Response Time (ms): It shows the forwarded response time in milliseconds.
By Template: In By Service, there are following fields:
Service Name: It is the name of the service.
Max TPS: The maximum transaction per seconds done by the service.
Avg TPS: The average transaction per seconds done by the service.
Template Name: It contains the name of the template.
Service Time (ms): It shows the service time in milliseconds.
Total Requests: : It shows the total number of request.
Total Duration (ms): ): It shows the total duration taken by the service.
Error%: The number of error occur in percentage.
Total Forwards: The total number of service forwarded.
Forward Response Time (ms): It shows the forwarded response time in milliseconds.